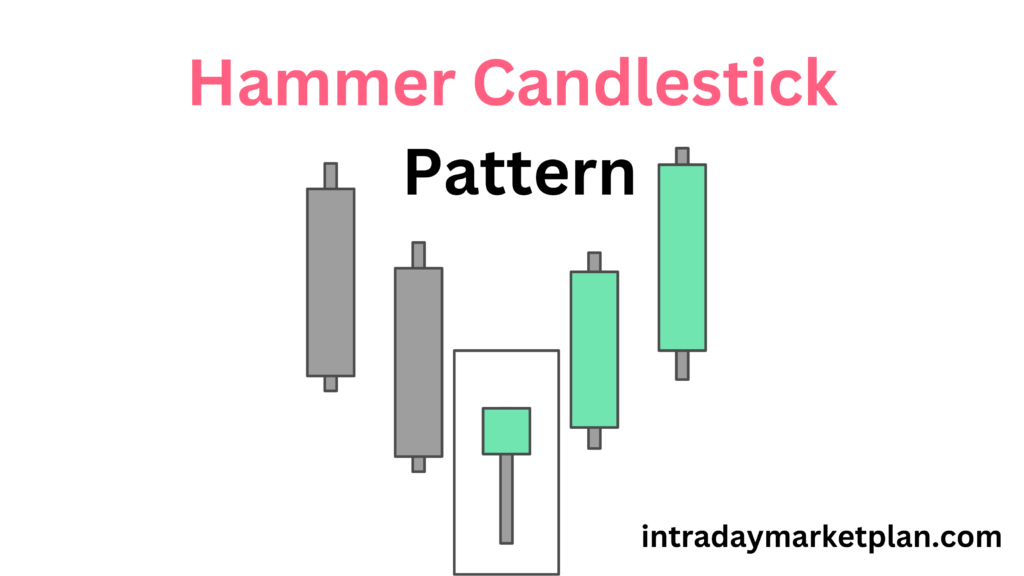
The Hammer candlestick pattern is a bullish reversal pattern that signals a potential shift from a downtrend to an uptrend in price action. It typically appears at the bottom of a downtrend, indicating that buyers are starting to gain control over sellers, which could mean a potential price reversal is on the horizon.
Characteristics of a Hammer Pattern:
- Shape: The Hammer candlestick has a small body (close and open prices are close together) at the top of the candle with a long lower shadow (tail), at least twice the length of the body.
- Color: It can be either green (bullish) or red (bearish), though a green hammer is often considered a stronger signal.
- Shadow: The lower shadow indicates that sellers initially pushed the price down during the trading session, but buyers eventually regained control, pushing it back up near or above the opening level.
How to Interpret the Hammer Pattern:
- Location: The Hammer must appear at the end of a downtrend to be considered a bullish reversal signal.
- Confirmation: Confirmation is essential. The next candle should ideally close above the Hammer’s close, indicating buying momentum.
- Volume: Higher trading volume in the Hammer candle or following it adds strength to the reversal signal, suggesting more buying interest.
Key Differences from Similar Patterns:
- Inverted Hammer: Appears at the bottom of a downtrend but has an upper shadow rather than a lower one, indicating potential resistance.
- Hanging Man: Has the same shape as the Hammer but appears at the top of an uptrend and is generally a bearish signal.
Example:
If the price of a stock has been declining and a Hammer appears, this could indicate the end of the selling trend, suggesting it may be a good time to look for buying opportunities. However, it’s crucial to confirm the reversal by observing the price action in subsequent sessions.